技术饭
chart.js设置饼状图和甜甜圈图
chart.js设置饼状图和甜甜圈图,饼图和环形图表可能是最常用的图表。它们被分成不同的部分,每个部分的圆弧表示每个数据的比例值。该图表在展示数据之间的关系比例方面非常出色。饼图和环形图在 Chart.js 中实际上是同一个类,但有一个不同的默认值 - cutoutPercentage。意味着内部的百分比被减少。饼图默认为 0,甜甜圈默认为 50。该图表在Chart核心中注册了两个别名。除了不同的默认值和不同的别名,其他是完全一样的。
定义canvas:
<canvas id="chart" width="1000" height="300"></canvas>
js代码:
<script>
$(function(){
setChart();
});
function setChart(){
//配置
var options = {
//Boolean - Whether we should show a stroke on each segment
segmentShowStroke : true,
//String - The colour of each segment stroke
segmentStrokeColor : "#fff",
//Number - The width of each segment stroke
segmentStrokeWidth : 2,
//Number - The percentage of the chart that we cut out of the middle
percentageInnerCutout : 50, // This is 0 for Pie charts
//Number - Amount of animation steps
animationSteps : 100,
//String - Animation easing effect
animationEasing : "easeOutBounce",
//Boolean - Whether we animate the rotation of the Doughnut
animateRotate : true,
//Boolean - Whether we animate scaling the Doughnut from the centre
animateScale : true,
//String - A legend template
legendTemplate : "<ul class=\"<%=name.toLowerCase()%>-legend\"><% for (var i=0; i<segments.length; i++){%><li><span style=\"background-color:<%=segments[i].fillColor%>\"></span><%if(segments[i].label){%><%=segments[i].label%><%}%></li><%}%></ul>"
};
//数据
var data = {
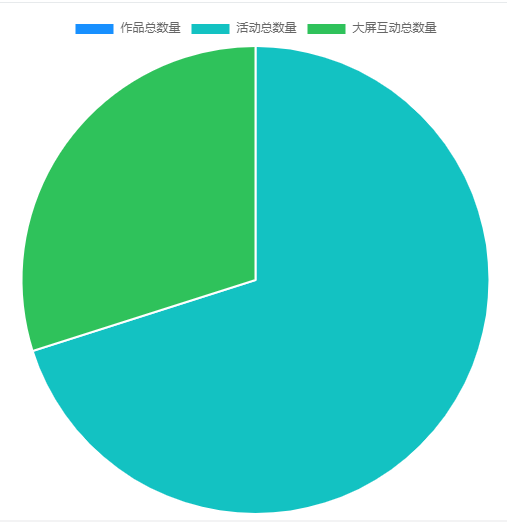
labels: ["作品总数量", "活动总数量", "大屏互动总数量"],
datasets: [
{
backgroundColor: ["#1890FF", "#13C2C2", "#2FC25B"],
data: [{$total_scene_count}, {$total_activity_count}, {$total_hudong_count}]
}
]
};
//实例化图表
var ctx = $('#chart').get(0).getContext('2d');
var currentMonthChart = new Chart(ctx, {
type: 'pie', //doughnut是甜甜圈?图形, pie是饼状图
data: data,
options: options
});
};
</script>
效果:

参考:https://blog.csdn.net/qq_25652949/article/details/89448261


文明上网理性发言!